Latency Profiling in Python: From Code Bottlenecks to Observability
Posted on Sat 29 November 2025 | Part 2 of Low-Latency Fundamentals | 19 min read
In the previous article, we've mapped the terrain where latency hides: from the wire through the NIC, into kernel space, across the user-space boundary, and finally into application code.
The next logical step is to quantify time spent at each stage of request processing, attributing cost to specific code paths, system calls, and data movement operations.
1. Introduction: Why Averages Are Dangerous

The trading system reports an average latency of 10ms. The monitoring dashboard is green. Everything looks fine ... until it isn't.
Suddenly, a big losing trade flashes across the screen. Post-mortem shows the system took 83ms to respond during a volatility spike, and by the time the order hit the exchange, the price had already moved.
This is the problem with averages: they hide the disasters.
This is why seasoned engineers obsess over percentiles such as the 95th, 99th, and 99.9th.
Recommended reading: How to Lie with Statistics by Darrell Huff
2. The Anatomy of Latency
To understand why averages fail, we first need to understand what time actually means inside a system.
Performance Profiling vs Latency Profiling
- Performance profiling tells you where your code spends time on average.
- Latency profiling chases the tail (e.g. the 99th percentile): the rare outliers that wreck performance guarantees.
Dimensions of Time
Latency is multi-dimensional. Several clocks tick inside every system, each telling a slightly different story.
- Wall Clock Time is what users experience: the real duration between start and finish.
- CPU Time is how long your code actually ran on a CPU core. If your process spent
1mscomputing and2mswaiting for a database query to return, the CPU time is1mseven though wall time is3ms.

💡 Demo: Fork the companion GitHub repo and run
python 01_wall_time_vs_cpu_time.py
You'll see something like:
Wall time: 1.530 s
CPU time:  0.529 s
One function burns CPU cycles, the other just waits. Both consume time but for different reasons.
Sources of Latency Worth Measuring
Latency shows up at every scale, from function-level operations to full system stalls.
- Micro-latencies: small delays inside your process: function calls, allocations, cache misses, context switches, lock contention
- Macro-latencies: larger, system-wide delays: queueing delays, garbage collection, network jitter, I/O stalls, thread starvation
3. The Shape of Latency
Don't think of latency as a fixed number, but rather as a distribution. Most requests are fast, some are slow, and a few are very slow.
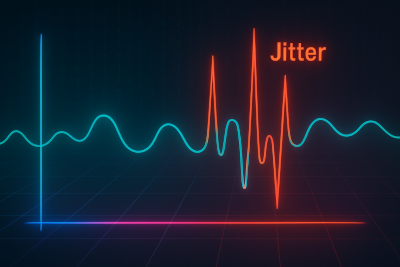
Variance matters as much as the mean. In low-latency systems, jitter is the enemy and can come from multiple places:
- The kernel scheduler parking the thread for a few milliseconds
- The garbage collector deciding to run at a bad time
- Unexpected disk or I/O contention
- etc...
Propagation and Amplification
In complex systems, latency propagates: one slow call in a dependency can block queues upstream, starve worker threads, or delay downstream consumers. Once a system starts queuing, every new request arrives late and leaves later. That's how localized slowness turns into global lag.
Even measuring it introduces small distortions: sampling overhead, clock drift, or instrumentation noise all add their own micro-latencies.
4. Profiling Latency in Python
Python profiling focuses on application-level behavior: how the runtime and code structure shape latency.
- Time spent in functions or coroutines
- I/O blocking vs CPU-bound work
- Event-loop delays, lock contention, garbage collection pauses
- How abstractions and the interpreter shape latency
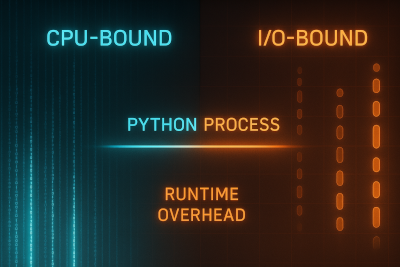
Latency profiling is a workflow: the first step is determining whether the system is CPU-bound or I/O-bound, and then selecting the profiler that exposes that dimension of time.
Tools of the trade
Python hides a lot behind abstractions: the GIL blocks real parallelism, native extensions skip tracing, and async code bends the idea of time.
Despite this, Python still has many solid profilers, each useful for a different slice of the latency picture.
| Tool | Key Strength | Use Case |
|---|---|---|
cProfile |
Deterministic CPU profiling (per function) | Quick CPU time breakdowns during development |
| py-spy | Sampling profiler with near-zero overhead | Safe for production profiling without code changes |
| line_profiler | Line-by-line CPU time | Fine-grained analysis of compute-bound functions |
| snakeviz | Interactive visualization | Visual exploration of cProfile or py-spy output |
CPU Profiling
When latency comes from computation, the goal is to see where the CPU actually burns cycles. Profilers turn wall-clock time into actionable structure: function calls, line hits, and call stacks you can reason about.
💡 Demo: Fork the companion GitHub repo and profile a CPU-bound workload by running these commands:
pip install snakeviz
python -m cProfile -o profile.pstats 02_profile.py cpu
snakeviz profile.pstats
cProfile records every function call and its cumulative execution time, while snakeviz turns that data into an interactive call graph that makes hotspots instantly visible.
For a finer-grained look, we can use line_profiler to extract line-level profiling. Run:
pip install line_profiler
kernprof -l -v 03_slow_function.py

But not all latency comes from computation. In async systems, the slowest part is often waiting.
Wall-Time Profiling (Capturing Async Delays)
When the code mostly waits, CPU profilers miss the story. We need a wall-clock view, a profiler that samples what's happening over real time, not just active execution.
py-spy does exactly that: it watches the process from the outside and captures where time actually goes.
pip install py-spy
py-spy record -o profile.svg -- python 02_profile.py
Open profile.svg and you'll see a flamegraph of total latency: wide stacks mean real CPU burn and tall, narrow stacks usually reveal time spent waiting.
5. From Profiling to Instrumentation
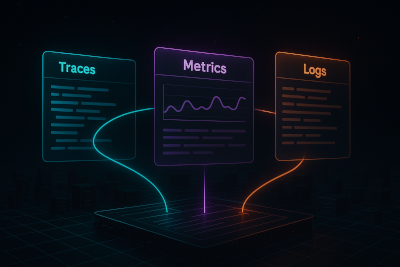
Instrumentation is the process of embedding measurement points inside software to collect metrics, traces, and logs about its execution , creating a continuous signal that reflects the system's real runtime behavior.
Whereas profiling shows where time goes, instrumentation shows when and how often it happens.
Latency Histograms with Prometheus
The Prometheus Python client turns timing data into structured metrics.
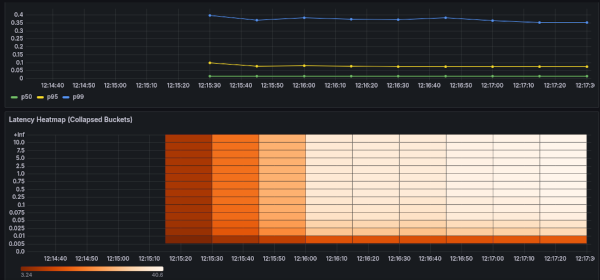
A Histogram tracks request durations across predefined buckets and exposes them via /metrics.
Prometheus scrapes those buckets, and Grafana turns them into live quantiles such as p50, p95, p99.
💡 Hands-on demo: Spin up a Python service + Prometheus + Grafana (pre-wired dashboard) by running:
cd 04_grafana_demo && sh run.sh
Once it's up, open Grafana and watch the dashboard update in real-time (admin / admin) and go to Dashboards -> Python Latency Profiling Demo.
Beyond Prometheus: OpenTelemetry
While prometheus_client exposes metrics, OpenTelemetry brings structure and context: a unified data model for metrics, traces, logs, and profiles, which can be exported to multiple backends such as Tempo, Datadog or Jaeger.
OpenTelemetry bridges raw metrics and full tracing, turning scattered data into a connected view of the system across all services.
For a broader view of how telemetry scales beyond a single process, see Observability at Scale: Distributed Telemetry for Modern Trading Infrastructure.
Sampling vs Always-On Timing
Instrumentation isn't free. Recording every request gives perfect granularity, but adds overhead. Sampling reduces cost, but smooths away rare outliers.
Choosing between them depends on context: debug builds can afford detail while production systems need low-overhead sampling.
Once low-overhead instrumentation is in place, the next step is to keep measuring it continuously.
6. Continuous Latency Profiling in Production
Profiling during development shows what's slow in isolation. Continuous profiling reveals what becomes slow over time, under load, over weeks, and across versions.
Why It Matters
Latency isn't static. It shifts with load, garbage collection pressure, deployment patterns, etc... A coroutine that looks fine in benchmarks might stall under real concurrency. Or a new dependency might add blocking I/O.
While traditional profiling is reactive (e.g. attach a profiler after something breaks), continuous profiling is preventive: it keeps a rolling view of where time is being spent.
As Datadog puts it in Why Continuous Profiling Is the Fourth Pillar of Observability, continuous profiling helps gain visibility into the runtime behavior of their production code.
Their follow-up article, Analyze Code Performance in Production with Datadog Continuous Profiler, demonstrates how to troubleshoot performance issues in live systems.
How Continuous Profilers Work
Continuous profilers take periodic snapshots of the call stack across threads. They aggregate these samples into flamegraphs or time-based profiles that reveal which functions dominate runtime.
Tools like py-spy and scalene run quietly in the background with negligible impact.
Cluster-wide profilers such as Parca and Pyroscope merge samples from multiple nodes into a unified view of system latency.
The Precision–Overhead Trade-off
Sampling rate is the main trade-off: higher frequencies (e.g. 99 Hz) expose micro-events but cost more CPU cycles; lower ones (10-50 Hz) smooth the picture and reduce cost, ideal for continuous use in production.
Visualizing and Acting on the Data
Continuous profilers feed a live stream of samples into the observability stack. Flamegraphs and timelines update automatically, revealing how hot paths evolve under real load.
Deployments and configuration changes should be marked in the timeline. These annotations turn time into context: letting latency spikes align with the exact moment a new version, dependency, or configuration change went live.
Latency Symptom → Diagnostic Action
These are some latency signals that surface in production. If you can read them, you can fix them before they spread.
| Symptom | Likely Cause |
|---|---|
| High wall time, low CPU time | I/O wait / blocking calls |
| High CPU, wall time steady | Hot loop / inefficient code |
| Big p99 ≫ p50 gap | Queueing, lock contention, or GC |
| Event-loop lag | Blocking sync calls on the loop |
| Latency jumps after a deploy | Regressed code or dependency |
The Playbook
- Measure wall and CPU time separately
- Track distributions, not averages
- Capture p95/p99/p999
- Profile CPU and I/O paths
- Instrument real request paths with histograms
- Continuously profile in production
7. Closing the Loop
Tools evolve and runtimes change, but the principle doesn't: measure before optimizing, observe before tuning. Every layer adds friction, every trace reveals truth.
In performance engineering, the first optimizer is visibility.