Observability at Scale: Distributed Telemetry for Modern Trading Infrastructure
Posted on Sat 13 December 2025 | Part 4 of Distributed Systems in Finance | 22 min read
1. What Distributed Telemetry Really Means
Distributed telemetry is the synchronized observation of a system's internal state across multiple components, services, and data centers.
Unlike monolithic logging, where a single application emits a linear stream of events, distributed telemetry coordinates observations from many locations, each generating high-volume data that must align in both time and context.
The evolution from simple logging to modern telemetry represents a shift in how we understand system behavior. Logs once told a linear story from a single process whereas telemetry extends that into a distributed stream built on three pillars:
- Metrics measure continuity: queue depth, latency, throughput. They show how much and how fast.
- Logs record discrete events: rejects, disconnects, config changes. They show what happened.
- Traces connect cause and effect across services: following an order from gateway to settlement. They show why it was slow.
In modern systems, these pillars merge into a unified observability layer, correlated by timestamps and context.
2. From Monitoring to Observability Platforms
Telemetry at scale is about how the signals (metrics, logs, traces) are modeled, queried and correlated. Over time, observability has gone through three clear phases. Each one changed how engineers reason about causality, correlation and exploration depth.
Monitoring 1.0: The Application Performance Monitoring Era
Tools like New Relic focused on measuring what happened inside the app itself: request latency, error rates, slow database calls, CPU time. The model was simple but powerful: one service, one agent, one dashboard. It worked well for monolithic architectures where most problems stayed within the application boundary. But as systems became distributed, that model started to fall apart.
Monitoring 2.0: The Cloud-Native Expansion
As microservices and containers took over, monitoring had to scale horizontally. Platforms like Datadog unified metrics and traces across entire fleets. The focus moved from single apps to fleet-level visibility: standardized dashboards, auto-instrumentation, and alert pipelines for every team. But digging deeper was still hard as everything revolved around predefined metrics.
Observability 3.0: The Event-Driven Model
Honeycomb redefined telemetry around events instead of aggregates. By keeping raw, high-cardinality data, engineers can slice by any dimension (such as build ID, feature flag, request path) without re-instrumenting code. This event-driven model enables real exploratory debugging and fits complex, high-throughput systems where rare anomalies need to be isolated fast.
Modern observability platforms may differ in philosophy, but under the hood, they all rely on the same fundamental pipeline.
3. Anatomy of a Telemetry Pipeline
Every observation follows a journey through multiple stages before it becomes actionable insight:
Code Instrumentation → Local Agent → Collector → Message Bus → Storage → Query Layer
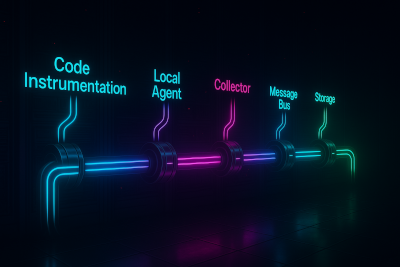
The four core layers below form the backbone of most modern telemetry pipelines:
- Edge Collection happens nearest to where signals originate (in the application code and at the network gateway). This is where order handlers, pricing engines, and risk checks emit lightweight telemetry. Edge collectors must be non-blocking.
- Aggregation Nodes receive raw telemetry streams from hundreds of edge sources and perform initial processing. These might be OpenTelemetry Collectors, Kafka clusters, or NATS streams. Aggregation reduces fan-out and absorbs bursts before data reaches storage.
- Hot vs Cold Path defines how telemetry flows. The hot path carries live metrics stored in memory or fast storage with short retention. The cold path archives historical telemetry data.
- Schema and Compression become critical at scale. Ingesting billions of data points per day amplifies small inefficiencies. Mature telemetry pipelines rely on compact formats like Protobuf and carefully versioned schemas to support rolling upgrades without breaking ingestion.
Together, these layers define how telemetry moves from runtime noise to structured, queryable data.
Once the pipeline is in place, the harder question is what's actually worth collecting.
4. What to Collect (and Why It's Different in Trading)
The Layers of Telemetry
In distributed trading systems, the challenge is deciding which signals enable real-time decision-making and which just add noise. Telemetry spans three layers:
- System-level telemetry tracks infrastructure health: CPU utilization, memory usage, garbage collection pauses, system calls, network buffers, thread queues.
- Application-level telemetry measures business logic performance such as order queue depth, message latency, risk check times, market data feed lag, tick-to-trade latency.
- Business-level telemetry monitors trading outcomes such as fill rates, slippage, PnL outliers, liquidity stats.
Metrics vs. Events vs. Traces
Understanding when to use each telemetry primitive is crucial:
- Metrics track continuous state: queue depth, latency, throughput, error rates. They are lightweight and built for aggregation over time.
- Events mark rare but important changes: disconnects, GC pauses, service failovers. They carry richer contexts.
- Traces follow a request as it moves through multiple services, linking operations into a causal chain.
💡 The real insight comes from connecting signals across layers. When a latency metric spikes, traces show where the slowdown occurred across services, and events explain what was happening around that moment.
In trading systems, the same principle applies: a CPU spike (system layer) might cause higher tick-to-trade latency (application layer), eventually degrading fill quality (business layer).
Timestamp Precision
In latency-sensitive trading systems, timestamp precision is the foundation of meaningful observability.
- Nanosecond timestamps are mandatory at that scale. They reveal the true order of execution and precise timing between events.
- Hardware timestamping beats software every time. When packets are timestamped directly by the NIC, kernel jitter, scheduling delay, and system-call noise are avoided.
- Clock synchronization via Precision Time Protocol (PTP) delivers roughly ±100 ns accuracy across datacenters, while NTP drifts by about ±1 ms.
- Sequence numbers complement timestamps for ordering. Perfect clock sync doesn't guarantee unique timestamps, but a monotonic sequence ID does.
5. Collecting Without Killing Performance
Full-fidelity telemetry for every event in a high-frequency system isn't practical. The challenge is collecting enough to stay observant without slowing the system itself.
Several patterns help manage that tension:
- Sampling reduces volume by capturing a representative subset, for example, recording full traces for 1% of orders in normal conditions and 10% during anomalies.
- Adaptive sampling scales with system load, reducing telemetry overhead when the system is under pressure.
- Aggregation windows sacrifice individual event visibility for statistical summaries.
- Context-aware instrumentation captures more detail when something looks abnormal. For example, emitting a full trace only when latency crosses a threshold.
- Lightweight agents emit metrics asynchronously and never block the critical path.
- Edge collectors cut network fan-out and aggregation overhead: services write to a nearby collector over shared memory or a Unix socket, and only aggregated batches travel upstream.
- No GC, no locks: the telemetry path must stay allocation-free and non-blocking.
The observability paradox applies: measuring performance must not become a performance problem.
Under load, even telemetry pipelines need armor: systems must be built for warfare.
6. Transport and Aggregation
Telemetry must move as fast as the systems it observes without ever getting in their way. The transport layer is where isolation, backpressure, and smart trade-offs between reliability and latency decide whether observability helps or hurts performance.
- Message buses: such as Kafka or NATS move telemetry through the stack.
- Aggregation layers: local collectors feed regional and global tiers, batching and filtering data to keep central systems from overloading.
- Backpressure and flow control: when downstream systems fall behind, collectors must adapt by buffering, batching, or discarding low-priority signals.
- Bursty workloads: loss-tolerant paths for metrics, reliable ones for critical events like order rejections.
- Schemas and protocols: Protobuf for efficiency, OTLP for standardization or JSON for easy debugging.
Once telemetry reaches its destination, storage becomes the next challenge.
7. Storage

Storage isn't one-size-fits-all, each signal type demands its own persistence strategy:
- Metrics: time-series databases optimized for append-only writes and temporal aggregation.
- Logs: columnar stores, designed for high-volume text search and filtering.
- Traces: graph-like stores that capture request flows across services, indexed by trace ID for dependency and latency analysis.
Storage doesn't end at ingestion. The real complexity begins once data is in motion: how it cools, ages, and gets optimized over time.
- Indexing and retention follow the physics of storage: hot data lives in RAM or SSDs for real-time queries, warm data cools to slower disks, cold data goes to object storage (cheap, durable, slow).
- Compression and deduplication keep storage efficient at scale.
- Query patterns dictate what data stays hot and what cools to warm or cold.
- Unifying historical and live data challenges traditional database architectures. Freshness always costs something.
8. Real-Time Insights
Collecting and storing telemetry is the foundation. Extracting insights is the endgame. Observability only becomes valuable once it closes the feedback loop.
- Streaming dashboards display real-time state. Grafana works for general observability, but high-performance environments rely on custom dashboards built around their workflows.
- Percentile-based alerting is essential in environments where tail latencies dominate. Alert on P99 or P99.9 breaches, or when the gap between median and tail widens to signal degradation before it breaks production flow.
- Context-aware alerting adapts to conditions. What's normal under heavy load is abnormal when the system is idle.
- Anomaly detection goes beyond static thresholds and finds patterns across signals that simple rules miss.
- Multi-window detection compares behavior across time horizons.
- Metric-trace correlation accelerates triage. When latency jumps, a single click from the metric view should land on traces revealing more context.
- Stakeholder-specific views keep focus aligned. Operators care about system health, traders about business outcome.
9. Inside a Live Market Incident
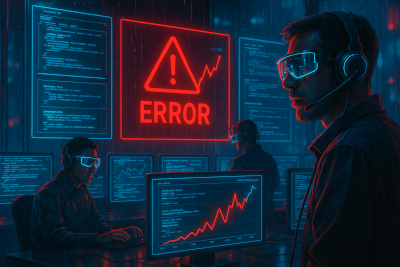
It's a calm afternoon. Markets are stable, fills are clean, and the system's running like clockwork. Until, without warning, order latency spikes.
- Detection: at
14:23:15, percentile alerts fire. P99 order-to-execution latency jumps from800 µsto12 ms. Orders are still flowing, but dashboards flicker red. Something's off. - Triage: dashboards light up. One gateway or all? One region or global? One symbol or everything? Within seconds, the team zeroes in: a single risk-engine cluster is misbehaving.
- Correlation: CPU usage and network throughput look normal, but garbage-collection pauses have doubled in the last few minutes. Pressure's building in memory.
- Tracing: captured traces for slow orders tell the same story: the risk check call skyrocketed from
200 µsto8 ms. - Logs: confirm the hypothesis: cache-miss counts explode. The risk engine is hammering the database instead of serving cached data.
- Timeline reconstruction: at
14:22:00, a config change rolled out new risk rules, pushing the cache beyond its limits. - Root cause: insufficient cache size for new risk parameters.
- Resolution: roll back the config. Increase memory. Latency drops, dashboards return to green.
Fast resolution comes from the same loop every time: detect early, correlate fast, trace causality, and rebuild the timeline.
10. The Future: Autonomous Telemetry

Observability is moving from measure and report into systems that adjust themselves based on what they see. As workloads get more dynamic and systems more distributed, the next generation of observability shifts toward autonomous behavior.
- Self-tuning sampling adjusts collection rates automatically based on system load, volatility, or detected anomalies. Future systems will continuously optimize the trade-off between observability fidelity and performance overhead.
- Telemetry as feedback for auto-scaling tightens the loop between observation and action: auto-scaling systems can provision additional resources before performance degrades.
- Hardware-offloaded telemetry moves fast-path instrumentation onto SmartNICs and FPGA counters. Timestamping, histograms, and basic aggregation happen on the hardware, removing CPU overhead.
- Integration with ML anomaly detection transforms telemetry from a diagnostic tool to a predictive one. Systems predict impending degradation from subtle signal combinations and take preventive action.
The vision is observability systems that continuously learn normal behavior patterns, detect deviations automatically, diagnose root causes without human intervention, and either self-correct automatically or provide operators with precise guidance.
The feedback loop from data to insight to performance compounds over time. Each resolved incident refines which signals matter most. Teams with superior observability make better decisions, faster.
📚 Distributed Systems in Finance - Part 4
Previous articles
- Part 1: Canton: A Distributed Ledger for Global Finance
- Part 2: Message-Oriented Architectures in Trading Systems: Patterns for Scalability and Fault Tolerance
- Part 3: What Database Scaling Looks Like When Milliseconds Mean Millions